
Data Analysis Services Offered by Expert
There are three main challenges that most people or organizations face when intending to collect and analyze data: Selecting the right sample, determining the right statistical tests based on the data collected and the research questions or research objectives, and properly interpreting the results after data analysis.
At Data-AnalysisServices.com, we provide expert solutions to all challenges in research design, sampling, data collection, data analysis, visualization, and report writing. We have helped individuals and organizations across the world in research and data analysis for the last 10 years, and we will be glad to assist you too.
In most cases, raw data is essentially complex and large in volume before it is processed and analyzed to identify hidden patterns and make meaningful conclusions. Analyzing data requires advanced skills and a comprehensive understanding of the analytical principles and methods of conducting different types of analyses; therefore, many people and organizations find the need to hire adept experts for professional data analysis services.
We have data experts who offer specialized services for individuals, organizations, or businesses in any field to derive useful insights from their data.
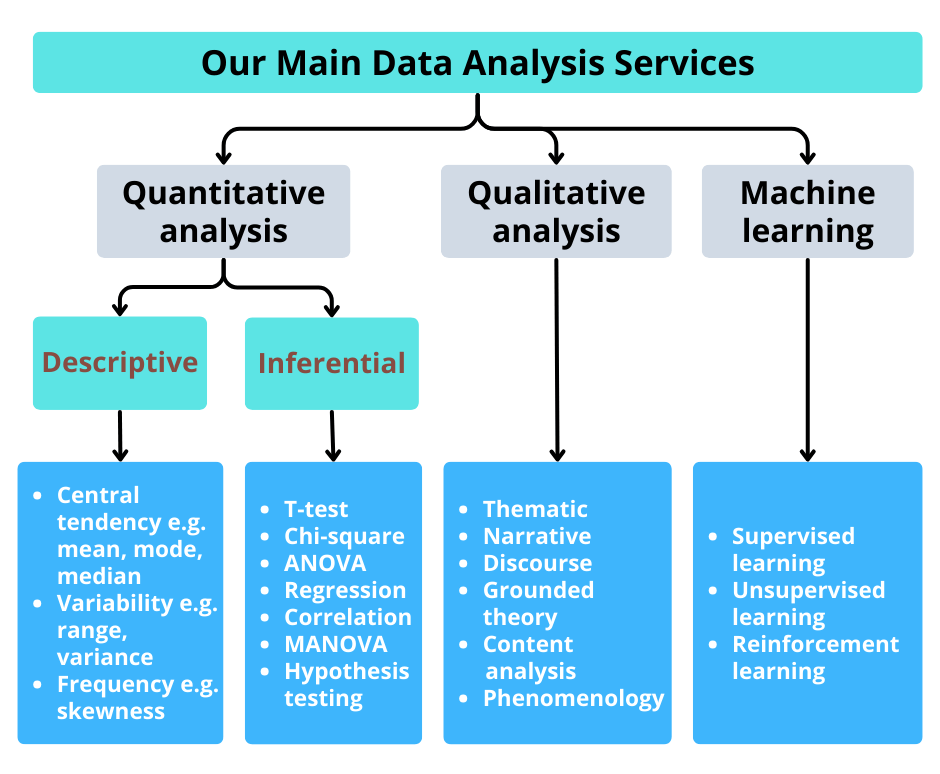
Below is an overview of the different types of services offered by our expert data analysts, such as quantitative and qualitative analysis, data analytics, and machine learning solutions. We have also listed some of the software we use to conduct various analyses, and the importance of hiring our service providers to help with data analysis.
With over 10 years of experience in data analysis and emerging technology, you are assured that we are the ideal company to assist you analyze your data, develop detailed visualizations, such as tables, graphs, and charts, and also write comprehensive and easy-to-understand reports based on the results.
What is Data Analysis?
Data analysis is the systematic application of analytical tools and techniques to raw data to identify patterns, trends, and insights to help make conclusions. Data analysis is classified into two main categories, qualitative and quantitative methods.
Qualitative data analysis involves the development of concepts and themes that enable the understanding of complex phenomena in natural settings, emphasizing the participant’s experiences and views.
Quantitative data analysis is the process of manipulating and interpreting numerical data to answer research questions, test hypotheses, or support decision-making.
Regardless of the nature of data you have, our data analysts and statisticians will be glad to assist you.
Data Analysis Services for Descriptive and Inferential Statistics
1. Descriptive Statistics Services
Descriptive statistics are applied to summarize data by outlining the relationship between variables in a sample or population. When providing descriptive statistics services, our experts use graphical displays or tables along with quantitative measures to provide information about a dataset. The types of descriptive statistics solutions applied by our professionals include the measures of central tendency, position, and variability.
(a). Measures of Central Tendency
Professionals from our company calculate three common measures of central tendency: The mean, mode, and median. The mean of a set of numbers is calculated by adding all the values in the data set and dividing by the number of observations. The median is the value in a systematic arrangement of numerical data that separates the numbers into two equal parts. The mode is the value that appears most frequently in a statistical distribution.
(b) Measures of Position
Measures of position are used to illustrate the relative location of an observation in a data set. The main measures of position applied by our professionals include: a.) Z-scores b.) Percentiles and c.) Quartiles. The Z-score represents the unitless distance that a data point is away from the mean of all observations based on the number of standard deviations. Quartiles are values that divide the ranked data into quarters. Percentiles are values of the variable that divide a set of ranked data into 100 equal subdivisions.
(c). Measures of Variability
Our experts utilize the measures of variability to demonstrate the degree to which data is spread out. The measures of variability describe the extent to which a variable’s values are similar or diverse and they include the range, variance, and standard deviation. The simplest measure of variability is the range, which is the difference between the smallest and the largest values in a data set. The variance is the gauge of the spread of data from the mean, and the standard deviation is the measure of how values in a data set vary from the mean.
2. Inferential Statistics Services
Inferential statistics involves the use of a sample to make a generalization to the whole population. Our professionals provide inferential statistics services to make approximations and test hypotheses. The two main categories of inferential statistics analysis services we offer include:
(a). Estimation
Estimation is the process of finding an approximate value of some parameter of a population from its random sample. Our data analysis service providers help our clients to determine the population parameter based on the model fitted on the data using two types of estimation: Point and interval estimation. Point estimation is where the approximate value is a single value. Interval estimation consists of two values within which the population parameter would lie. There are two main methods of estimation: Method of moments, and maximum likelihood estimation method.
(b). Hypothesis Testing Services
Hypothesis testing is a method for examining a claim about a parameter in a population using data measured from a sample. There are two main types of hypotheses: Null and alternative. The null hypothesis implies that there is no difference between two groups and the alternative states that there is a significant difference between two groups. Our professionals provide hypothesis testing services to our customers to determine the likelihood of a population parameter being true. of moments, and maximum likelihood estimation method.
Some of the common inferential statistical analyses include:
- T-tests: Independent sample t-test, paired t-test, one-sample t-test.
- ANOVA: One-way ANOVA, two-way ANOVA, repeated measures ANOVA.
- MANOVA: Multivariate analysis of variance.
- Chi-square: Chi-square test of independence, chi-square goodness-of-fit test.
- Correlation: Pearson correlation, Spearman’s rank correlation.
- Regression: Simple linear regression, multiple linear regression, logistic regression.
Looking for Primary Data Analysis Services? Our Experts Will Help
Primary data analysis is the evaluation of data collected firsthand by the researcher to answer research questions, test hypotheses, or support decision-making for businesses and organizations. Our professionals offer expert guidance on the type of primary data to collect based on our client’s research goals. Additionally, we provide primary data analysis services, helping our clients make sense of collected data, make conclusions, understand trends and patterns, or gain useful insights that lead to better outcomes.
Searching for Secondary Data Analysis Services? Let Our Experts Assist You
Secondary data analysis is a method of using collected data by other investigators to answer the research question, make conclusions, derive useful insights, test hypotheses, or support decision-making. It is applied when the only available data is secondary and when the investigator wants to save on cost. Our professionals help our customers use existing data to address new areas of inquiry, support or reject hypotheses, make conclusions, and identify potential businesses, among other outcomes.
Data Analysis Software Commonly Used by Our Experts
Our experts utilize advanced software to simplify the analysis process and present the findings using visualizations that demonstrate patterns and trends, enabling easy interpretation of results. Operating data analysis software requires theoretical and technical knowledge of the tools and functionalities to conduct an effective analysis and achieve the desired results. For data analysis services requiring advanced software, our experts offer personalized solutions tailored to the type of data to be analyzed. Common software we operate include:
(a). Quantitative Data Analysis Software
Quantitative methods typically involve objective measurements and the statistical analysis of numerical data collected through questionnaires, experiments, observations, or surveys. Quantitative research focuses on gathering numerical data and generalizing findings to answer a research question, prove a hypothesis, make predictions in businesses, or enable strategic planning. Our researchers apply quantitative data analysis software to analyze large data sets and identify patterns and trends. Common software tools our experts utilize include the Statistical Package of Software Sciences (SPSS), R, Excel, SAS, STATA, MINITAB, and Python.
(b). Qualitative Data Analysis Software
Qualitative methods involve the collection and analysis of non-numerical data to understand complex phenomena. Software used in qualitative research is normally referred to as the Computer Assisted Qualitative Data Analysis (CAQDA). These analysis software tools enable more sophisticated analysis, support analytical coding, evaluate for patterns in literature, and check for coding consistency. Common CAQDAs our professionals employ include NVivo, ATLAS.ti, and MAXQDA.

Why Use Our Quantitative Data Analysis Services?
Our experts provide quantitative data analysis services utilizing software such as SPSS, Excel, R, SAS, STATA, MINITAB, and Python to perform descriptive and inferential statistics, achieving the desired research goals. Our experts also design a quantitative approach to apply based on the provided data to conduct the analysis. The quantitative data analysis process followed by our professionals involves data preparation, conducting descriptive and inferential statistics, interpretation and visualization of results, and reporting findings.
Selecting the correct statistical method to calculate descriptive and inferential statistics requires advanced statistical knowledge of the techniques and the different types of variables to perform an effective analysis. Our experts offer specialized guidance in every step of the process, from data collection to conducting the analysis, and reporting of results.
Solutions Offered by Our Experts in Quantitative Data Analysis Services
(1). SPSS Data Analysis Services
SPSS is a Windows-based program applied to perform data analysis and create high-quality visuals for the presentation of results. Our experts provide SPSS data analysis services by applying the software’s analytical tools and functions to examine the similarities and identify hidden patterns and trends in the data set. After analysis, we use SPSS tables and graphs to create a high-quality presentation of the analysis results to demonstrate complex relationships between variables.
(2). Excel Data Analysis Services
Excel is a spreadsheet program that allows researchers to store, organize, and analyze data. Professionals from our data analysis company offer Excel data analysis services by using the spreadsheet program to track data, develop models for analysis, compose formulas to perform calculations on data and present the analysis findings using charts, graphs, and other visual elements. Examples of data analysis procedures our experts perform in Excel include but are not limited to: a.) Descriptive analysis. b.) Inferential analysis. c.) Predictive analysis. d.) Time-series analysis. e.) Prescriptive analysis.
(3). R Data Analysis Services
R is a programming language applied by our service providers to perform statistical analysis, graphic representation, and reporting of results. R is useful for data analysis due to its advanced features, which include: a.) Effective data handling and storage facility. b.) Graphical facilities for data analysis. c.) Integrated collection of tools for data analysis. d.) Tools for data collection. In the course of providing R data analysis services, our professionals utilize the programming language to identify patterns and trends in data, develop graphic presentations, and report findings.
(4). Python Data Analysis Services
Python is a programming language utilized by data scientists due to its user-friendly interface, versatility, and extensive standard library and community. Python is applied for data analysis because it can be employed to import datasets quickly, and its libraries make data analysis efficient by providing portions of ready-made codes. Our experts provide Python data analysis services by employing advanced libraries to clean, transform, analyze, and visualize data to derive meaningful insights.
Buy the Best Qualitative Data Analysis Services
Our professional data analysts provide qualitative data analysis services by offering expert guidance in a wide range of analysis methodologies, including content, thematic, narrative analysis, and grounded theory. Experts from our company begin by preparing the data, for example, transcribing interviews, to ensure that the data is ready for analysis. We then conduct a thorough review of the data to discover hidden patterns and themes. Our experts code qualitative data by assigning labels to demonstrate the different relationships between them. We then identify key themes and interpret the data.
Our experts guarantee high-quality data analysis services by ensuring our customers get reliable and accurate research findings. We also ensure we deliver the data analysis tasks to our clients on time without compromising on quality. Based on the research design, our data analysis service providers develop the most effective qualitative analysis method to apply to draw valid conclusions from data. Our professionals utilize the advanced analytical features of software such as NVivo and MAXQDA to organize, code, and visualize the data, hence identifying the patterns in qualitative and unstructured data.
Solutions Offered by Our Experts in Qualitative Data Analysis
NVivo Data Analysis Services
Our experts provide NVivo data analysis services through the application of its advanced tools and features to organize, clean, analyze, and visualize data to identify patterns and themes. We use NVivo to organize and code data sources into a single project and assign attributes to qualitative data. Features in NVivo that allow for qualitative data analysis include the software’s import tool that is used to transfer several document file types, including Portable Document Format (PDF) or textual data files.
MAXQDA Data Analysis Services
MAX Qualitative Data Analysis (MAXQDA) is a software tool applied to analyze qualitative data to reveal themes and patterns. Advanced features that simplify data analysis in MAXQDA include visualization features, availability of coded segments, and multiple data import options. Our professional data analysts offer MAXQDA data analysis services to identify patterns and trends from qualitative and mixed methods data to derive meaningful information.
Thematic Analysis Services in Qualitative Research
Thematic analysis in qualitative research is a method used to classify and present themes that relate to the data. When offering thematic analysis services, our professionals begin by familiarizing themselves with the data to understand the potential themes and patterns. We then generate initial codes, search, review, and define the themes. Our experts then compose a report that contains an illustration of the identified themes.
Machine Learning Data Analysis Services Offered by Our Experts
Machine Learning is a subset of Artificial Intelligence (AI) that enables computer systems to automatically learn and improve from experience without being manually programmed. There are 3 main types of machine learning, which include:
- Supervised machine learning.
- Unsupervised machine learning.
- Reinforcement machine learning.
The integration of machine learning in data analysis is attributed to the need to identify hidden patterns and trends in data that may be too complicated to be discovered using traditional methods. Our experts offer customized machine learning data analysis services in multiple research areas, such as healthcare, fraud detection in finance, or business. Examples of services provided by our professionals include automated data processing and analysis, identifying hidden patterns using clustering algorithms and association rule learning, performing predictive and prescriptive analytics, and conducting real-time analytics.
What Makes Our Data Analysis Services Outstanding?
Our company has some of the best experts with over 10 years of experience conducting data analysis for scholars, researchers, organizations, businesses, and companies across different fields. Professionals from our company have background knowledge in performing data analysis for tasks involving quantitative, qualitative, and mixed methods approaches.
Hiring our experts for quantitative and qualitative data analysis services assures our clients of exceptional results guaranteed to achieve the specified research objectives. By integrating advanced statistical analysis software and the expertise of our professionals, we deliver high-quality and accurate results to our clients.
Our data scientists, also offer customized services for multiple fields of research. Some of the solutions we offer include, but are not limited to, data visualization, report writing, and data analysis consultancy services. We develop data visualizations that contain a demonstration of the patterns and trends identified from the analysis that help make conclusions to support or reject hypotheses, guide decisions, and drive growth. Contact us today or join our live chat and our customer support agents will be glad to answer your questions or guide you through the Order Process.

Fast Turnaround
Get your data analyzed and report written within 24 hours or less.

Secure Payment
Pay Securely with PayPal, Visa, Mastercard, or American Express, among others.

Help Center
24-hour customer support center available via live chat and email.

Privacy and Data Protection
We guarantee that the service is confidential and your data is 100% protected.
Quick Answers
Have Questions?
What types of data analysis services do you offer?
We offer quantitative and qualitative analysis, market research, business intelligence, and machine learning services, among others.
How long does it take to complete a data analysis project?
The client gives us the timeline and we work within the indicated time. For small projects it takes 12 to 24 hours, for medium-range projects it takes about 2-5 days, and for large projects it takes 7 days to 1 month.
What do I need to provide to get started with my order?
- Title or topic of your project.
- The aim, research questions, objectives, or hypotheses of your research.
- The proposal (in case of a thesis or dissertation data analysis).
- The data you have collected.
- Any additional instructions on how you want the analysis to be conducted.
What kind of deliverables can I expect after data analysis?
We provide a report of the results including graphics such as tables, figures, and charts. The results are explained in an easy-to-understand language.
We also provide the output from the software used to do the analysis.
For business intelligence tasks, we provide a dashboard as part of the deliverables.
For machine learning tasks, or analysis with software such as R or Python, you will get the code used.
What are your operating hours?
We are a 24-hour online company. We always have a human customer support agent on live chat to answer your questions, give updates regarding your analysis, or assist you to place an order.
How do I get started with your data analysis services?
To get started, you can initiate a live chat with our customer support agents, you can also send us an email, or call us and we will be glad to assist you.