Get Expert Help to do the Chi-Square Test in SPSS
A chi-square test is a non-parametric technique used to evaluate the hypothesis between two or more groups and determine how likely the observed data distribution fits with the expected data distribution. Data analysts utilize SPSS’s advanced tools and functionalities to conduct a chi-square test and discover whether there is a significant relationship between two categorical variables. Are you looking for professional help to do chi-square test in SPSS? Our certified statisticians are the solution to your chi-square analysis needs. Whether you need assistance with conducting a chi-square test, interpreting findings, or composing analysis reports, we customize our services to fit our client’s research questions, objectives, and goals. In this article, we have highlighted the main types of chi-square tests our specialists assist with, the step-by-step process of running a chi-square test in SPSS, and how to interpret the results of a chi-square test in SPSS.
What is a Chi-Square Test?
A chi-square test is a statistical method used to determine if there is a statistically significant relationship between two categorical variables. Researchers conduct a chi-square test to determine whether an observed association between data is due to chance or if there is a genuine relationship between the variables under study. For expert assistance with running a chi-square test in SPSS, contact our professional consultants to learn how we can help with the analysis, interpretation, and reporting of results. Other software tools we utilize to conduct analysis include R, Python, SAS, and Stata, among others.
Types of Chi-Square Tests Conducted by Our Experts
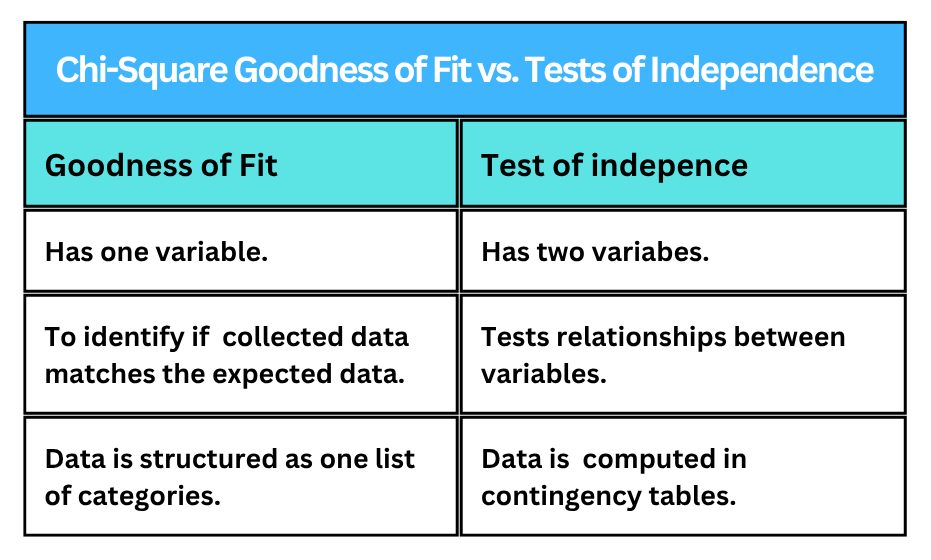
1. Chi-Square Test of Independence in SPSS
A chi-square test of independence is a practice used to determine whether there is a significant relationship between two categorical variables within a sample. When clients approach us for help with the chi-square test of independence in SPSS, we use the contingency table to calculate the expected values, compute the chi-square statistic, identify the critical value, compare the critical value and chi-square statistic, and decide whether to reject the null hypothesis. With our chi-square test of independence services in SPSS, clients can confirm the presence of a significant effect between variables, therefore enabling them to make decisions, answer research questions, and test hypotheses.
2. Chi-Square Goodness of Fit in SPSS
A chi-square goodness-of-fit test is a non-parametric test used to evaluate whether the observed distribution of categorical data aligns with the hypothesized distribution. With our chi-square goodness-of-fit test services in SPSS, our specialists help clients determine whether the observed values of the categories in the sample correspond to the expected values based on a known distribution. By getting help to conduct a chi-square goodness of fit test from our statisticians, our clients draw accurate conclusions about the distribution of a population based on a sample.
Get Help to do the Chi-Square Test in SPSS from Our Certified Statisticians
Our experts handle all the steps of chi-square analysis, including data cleaning, ensuring all assumptions are met, running the test, and drawing valid conclusions, as part of our chi-square analysis services in SPSS. When providing help with chi-square tests, our experts ensure that certain assumptions are met for the test to produce accurate and meaningful results. The assumptions for the chi-square test include: a). Data is collected randomly from the population, b). the sample size is large, c). each categorical variable is mutually exclusive, d) expected frequencies are evenly distributed, and e). observations must be independent. If any of the key assumptions of the chi-square test are violated, the results of the test may be inaccurate, therefore increasing the risk of type I or II errors, which is why professional assistance is crucial for conducting a chi-square analysis. In this section, we discuss how to run a chi-square test in SPSS and how to interpret the results.
How to Run a Chi-Square Test in SPSS
SPSS has a user-friendly interface and advanced tools and functionalities that experts apply to create contingency tables, run chi-square tests without manually computing formulas, and generate p-values, degrees of freedom, and significant values. When clients approach us for help to do chi-square test in SPSS, we apply the crosstabs procedure to evaluate the relationship between two categorical variables. The step-by-step procedure of running a chi-square test in SPSS involves:
Step 1: Load the data in SPSS. For accurate and valid results, the data must consist of two categorical variables, should have an independence of observations, and be collected from a large sample size.
Step 2: Click on Analyze> Descriptive Statistics> Crosstabs
Step 3: Select one variable to the row and another variable to the column in the crosstabs box
Step 4: Click on the Statistics tab and select the Chi-Square button to run the test. Then, click Continue.
Step 5: Specify the expected counts to compare the observed and anticipated values.
Step 6: Click OK after choosing the variables and statistical test to run the analysis and generate output.
How to Interpret Chi-Square Results
SPSS generates output that encompasses the case processing summary, crosstabulation, symmetric measures, and the chi-squares test table. Our experts not only help clients conduct a chi-square test but also assist with interpreting chi-square test results through our chi-square analysis services in SPSS.
First, our professionals determine whether the relationship between the categorical variables is statistically significant by comparing the p-value and the significance value. If the p-value is less than the significance value, the null hypothesis is rejected, and we conclude that there is a statistically significant relationship between the variables. If the p-value is greater than the significance value, then the null hypothesis is rejected.
Second, we evaluate the differences between the expected and observed values to decide which categorical variables have the most effect on the chi-square statistic. The more the expected and observed digits diverge from each other, the more likely the variables are statistically significant. For specialized assistance with interpreting the findings of the chi-square test in SPSS, contact our expert consultants.
Frequently Asked Questions About Chi-Square Tests
When to Use a Chi-Square Test?
Our professional statisticians provide help with conducting a chi-square test to test the relationships between categorical variables. We also use the chi-square test to compare an observed and expected distribution by computing the chi-square statistic. Another application of the chi-square test is to evaluate the difference in the distribution of categorical variables between two or more independent groups.
What are the Degrees of Freedom in Chi-Square Tests?
In chi-square tests, the degrees of freedom refers to a set of digits in a distribution that are free to vary independently without violating any constraints. To calculate the degrees of freedom in chi-square tests, we apply the formula: df = (r-1) (c-1), where r represents the number of rows and c stands for the number of columns. By computing the degrees of freedom in SPSS, we help clients in deciding whether to reject the null hypothesis based on the number of categorical variables within the experiment.
What is the Chi-Square Distribution Table Used for?
The chi-square distribution table provides a demonstration of the significant values obtained from the chi-square test. In a chi-square test, the chi-square distribution table is used to evaluate the relationship between two categorical variables and test whether the observed distribution differs from the expected distribution. By providing critical values such as p-values, significance levels, and degrees of freedom, our experts use the chi-square distribution table to determine whether the association between two variables is statistically significant. The table below illustrates the structure of the chi-square distribution table:
Significance level (α)

How do we Report Chi-Square Results from SPSS?
Our company’s professional statisticians provide specialized assistance with composing data analysis reports. In the introduction, we provide a background to the study, outline the research objectives, and briefly describe the categorical variables. We then illustrate the methodologies used for data collection and analysis. We present the results, highlighting significant p-values, chi-square statistics, and degrees of freedom. Our experts interpret the findings while demonstrating the significance of the results to the stated hypothesis. We include significant visuals that are easily understandable and then give a conclusion that summarizes the main points of the report.
For those in need of help to do chi-square test in SPSS, feel free to contact us today with any inquiries. Our professional data analysts are more than happy to assist you with chi-square analysis and all the associated processes. Our friendly customer service team is available 24/7 via live chat to ensure timely responses to all your inquiries and help you place an order. Reach out now for the best chi-square test services in SPSS.