How to Analyze Survey Data Using SPSS for Academic Publications
The analysis of survey data for academic publications using SPSS involves an organized procedure that encompasses data cleaning, validation, and inferential statistical analysis. The analysis follows several key steps, including checking data reliability, conducting normality tests, running descriptive statistics for demographic variables, and performing inferential analyses. For researchers seeking help with survey data analysis in SPSS, we have experts in handling statistical tools for analyzing data and interpreting results.
This article contains an explanation of the methods for analyzing survey data in SPSS, which include descriptive statistics, reliability analysis, and cross-tabulations. Also, we have discussed the process of analyzing survey data in SPSS for academic publications.
What is Survey Data Analysis Using SPSS?
Survey data analysis using SPSS involves systematically importing, cleaning, managing, and analyzing data within a statistical software environment. The analysis process entails generating frequency tables, descriptive statistics, and crosstabs, as well as conducting inferential tests such as ANOVA and regression. By analyzing survey data in SPSS, a researcher can convert responses into accurate insights that inform decision-making and support evidence-based conclusions. The most common uses of survey data include market research, social science studies, and client satisfaction assessment.
Methods for Survey Data Analysis in SPSS
Using appropriate methods of research for survey data analysis in SPSS is crucial for reliable, accurate, and efficient insights. Suitable methods for survey data analysis using SPSS include;
1. Descriptive Statistics in SPSS
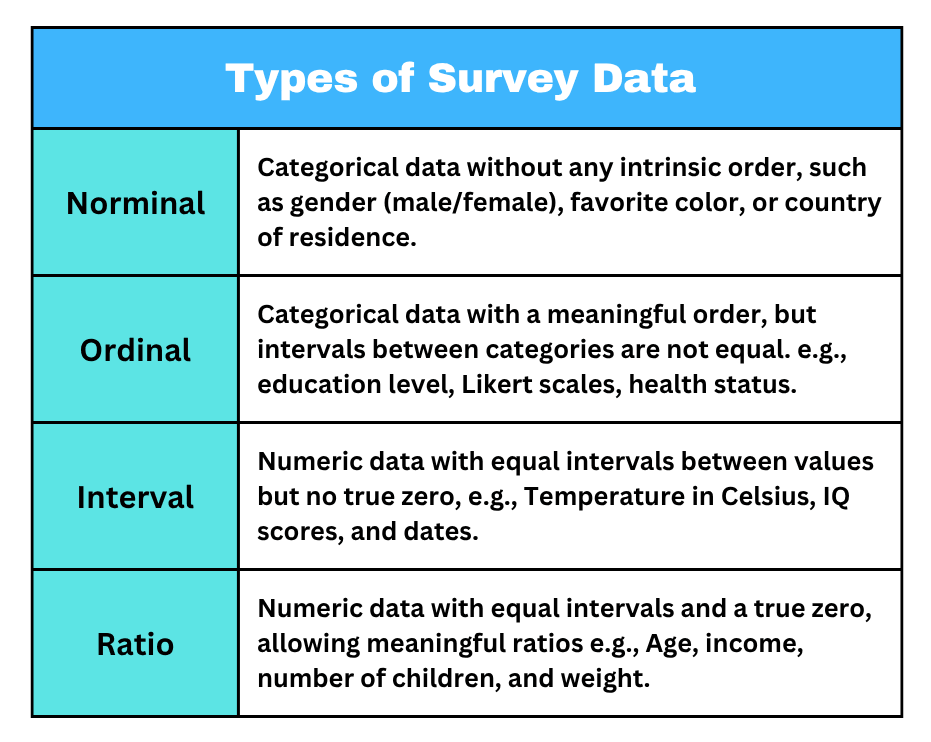
Descriptive statistics in SPSS summarize key characteristics of the data, including measures of central tendency such as mean, median, and mode. They also describe data dispersion, including standard deviation and range, to provide an overview of the findings. Through descriptive statistics, researchers can obtain frequencies for definite variables and arithmetic summaries to discover patterns and detect missing data and outliers.
2. Reliability Analysis in SPSS
Reliability analysis in SPSS assesses the consistency of survey data. Cronbach’s Alpha is commonly used to evaluate the reliability of Likert-scale items. Through reliability analysis in SPSS, students can navigate the scale to check internal consistency using alpha values such as >0.7 or 0.6. Proper reliability analysis in SPSS also helps researchers to indicate the questionnaire’s reliability and consistency.
3. Cross-Tabulations in SPSS
Cross-tabulations (crosstabs) in SPSS are used to analyze survey data by comparing two or more categorical variables. The cross-tabulation method is conducted by creating contingency tables to organize, summarize, and analyze the relationship between variables. Cross-tabulations in SPSS are also appropriate for identifying relationships between variables, such as gender and opinions, through a display of counts, percentages, and optional chi-square tests to define statistical relevance.
4. Comparison of Means in SPSS
Comparison of means in SPSS is a suitable method of analyzing survey data, entailing an appraisal of differences in continuous variables across categorical clusters. Statistical tests for comparing means include independent t-tests for two groups and ANOVA for three or more groups. Essentially, comparison of means in SPSS is ideal for assessing group averages, for example, determining how satisfaction levels vary between men and women.
5. Factor Analysis in SPSS
Factor analysis in SPSS is a method of analyzing survey data by reducing bulky information into fewer and more manageable factors based on shared variance. Factor analysis in SPSS allows researchers to identify latent variables using extraction methods such as Principal Axis Factoring. Key steps in factor analysis include assessing data suitability, determining the number of factors, and interpreting the results.
6. Regression Analysis in SPSS
Regression analysis in SPSS is a powerful technique for predicting outcomes and examining relationships between variables in survey data. Regression analysis entails testing the independent variables’ impact on a dependent variable. Regression analysis provides R2values to assess model fit and beta coefficients to determine the significance of predictors. Key steps in regression include data preparation, variable selection, and conducting the analysis.
The Process of Analyzing Survey Data in SPSS for Academic Publications
Survey data analysis in SPSS for academic publication is an essential and sequential process designed for ascertaining reliability, integrity, and validity. The process of analyzing survey data entails;
1. Prepare Survey Data for Analysis
Before the analysis of survey data in SPSS, a researcher must ensure it is well-prepared. The preparation process entails the data importation and cleaning, and variable definition. Preparation of survey data is a crucial phase before the analysis process, to allow for applicable statistical methods and avoid inaccurate conclusions. For academic publications, it is important to document the data analysis process for reproducibility.
2. Explore and Understand Survey Data
Analyzing survey data in SPSS is essential in obtaining accurate insights that cannot be derived from raw data. To make the questionnaire responses meaningful, it’s crucial to explore and understand the data, which entails identifying patterns, detecting mistakes, and determining the appropriate statistical tests to conduct. During data exploration, SPSS provides suitable tools essential for generating descriptive statistics and visualizations, facilitating easier interpretation of the results.
3. Run the Right Statistical Analysis Based on the Research Questions
With clean and well-organized survey data, a student should proceed to select the most suitable statistical tests to conduct. The type of statistical analysis a researcher conducts should be consistent with the research questions and variables involved. Additionally, it’s crucial to match the analysis method with the data being used to draw accurate conclusions and avoid unnecessary errors.
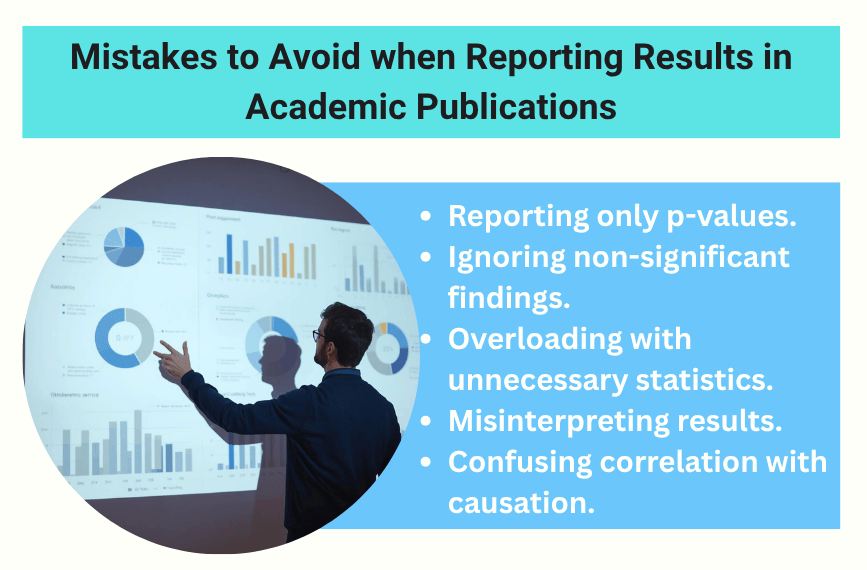
4. Interpret and Report Results
Interpreting and reporting results is crucial in SPSS survey data analysis for academic publications. The interpretation process entails summarizing key results, identifying trends, and explaining the meaning of the outcome of the research questions. Additionally, when using statistical methods such as t-tests, descriptive statistics, correlation coefficients, and ANOVA, a researcher should carefully interpret key metrics, including means, standard deviations, and p-values.
Why do Students Seek Assistance with Survey Data Analysis in SPSS from our Experts?
Below is a detailed explanation of the reasons why scholars seek assistance with survey data analysis from our professionals.
- Required complex software skills: Our experts have mastery in using SPSS; therefore, they effectively assist students to import, clean, manage, and analyze survey data.
- Methodological challenges: We have a team of professional survey data analysts who assist students in selecting the correct statistical tests to run, formulate hypotheses, or handle missing outliers.
- Need for accurate interpretation: Our professionals assist students in interpreting results to understand what the numbers mean for research hypotheses.
- Tight deadlines: Our SPSS experts are both skilled in analyzing survey data and highly time-conscious; therefore, they help students submit professional work within deadlines to improve chances of attaining high grades.
- Correction of errors: We have skilled SPSS data analysts who help researchers to detect and correct errors in the findings to ensure validity.
Summary
Analyzing survey data using SPSS entails a few steps, which range from preparing and cleaning data to conducting statistical tests and interpreting results. Through proper analysis, a researcher can confidently explore data using descriptive statistics, examine relationships through regression and correlation analysis, and use t-tests and ANOVA to compare groups.
Our experts are adept at cleaning data, selecting appropriate statistical tests, and interpreting outcomes accurately. With our expert assistance with survey data analysis in SPSS, publishing research findings is possible for researchers ready to attain success. Reach out to us today by joining our live chat to talk to our customer support team, or contact us for any inquiries.