Understanding Linear Regression Analysis
Linear regression analysis is a fundamental statistical method that enables researchers to investigate the relationship between different variables. Linear regression analysis is widely applied in various industries to make predictions, understand trends, and inform decision-making using available data. Making data-driven success possible is the main advantage of understanding linear regression. You may be wondering, where can I get help with linear regression analysis from an expert statistician? Our team of experts supports researchers throughout the linear regression analysis process, ensuring they obtain accurate and reliable findings. The article contains a discussion of linear regression, its various types, main elements, steps, and assumptions, along with a linear regression example.
What Is Linear Regression?
Linear regression is a statistical technique that models the connection between a dependent variable and one or more independent variables. Linear regression is named as such because of its assumption that there is a straight-line connection between the variables. Linear regression forecasts are obtained using input data and assess the strength of the relationships.
The simple linear regression formula is Y = β₀ + β₁X + ε, where Y is the dependent variable, X is the independent variable, β₀ is the intercept, β₁ is the slope, and ε is the error term. The goal is to identify the line that best fits the data, minimizing the difference between predicted and actual values. The line is used to predict the relationship between the variables and helps make future judgments more confidently.
Although the formula is simple, real-life situations often include unusual cases, similar variables, or unusual trends. For this reason, researchers may opt to hire linear regression analysts to help in developing accurate models. If data issues are spotted and solved by expert statisticians early, the model can be trusted, and the insights will be more dependable.
Types of Linear Regression Analysis
Linear regression does not work similarly in every situation. The type of linear regression depends on the number and kind of variables being studied. Making the right choice of linear regression helps researchers produce useful and practical results. Identifying these types helps researchers decide on the best model for their study.
1. Simple Linear Regression
In simple linear regression, there is only one independent variable and one dependent variable. It is useful in situations where relationships are straightforward, such as estimating test scores from the time spent studying. Simple linear regression is straightforward to grasp and understand, but it is limited in its scope.
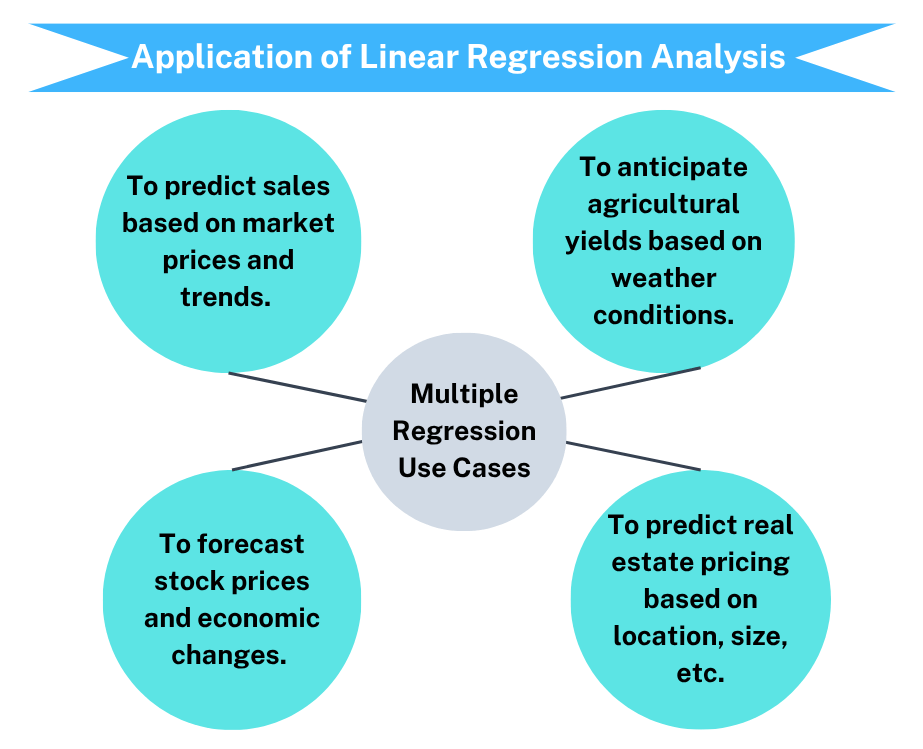
2. Multiple Linear Regression
Multiple linear regression involves using two or more independent variables to predict a dependent variable. For example, to predict the price of a house, one needs to consider its size, location, and age. When dealing with such cases, seeking help with linear regression analysis from an expert statistician is recommended, as these professionals can help researchers understand the relationship between variables.
3. Multivariate Regression
Multivariate regression is a more advanced type of linear regression. Multivariate regression allows for the prediction of several dependent variables at once. Multivariate regression is a specialized technique, and our experts are equipped with the necessary skills to provide high-quality linear regression analysis assistance.
4. Regularized Regression
Regularized regression is a more advanced version of linear regression analysis. It prevents the model from fitting too well to the training data in situations with most dimensions. Regularized regression is a technique that is used less often and requires more advanced skills to apply. Our team of experts possesses the advanced analytical skills necessary to conduct regularized regression analysis. Therefore, you can feel confident in hiring one of our experts for regression analysis.
Main Elements of Linear Regression
Every aspect of linear regression contributes to how the model explains the relationships among variables and how accurate it is in predicting results. Understanding these concepts is essential when researchers want to create, assess, and accurately explain regression analysis.
1. The Dependent Variable (Y)
Y is the dependent variable the researcher is trying to explain or predict. Y is the outcome being measured and changes in response to the independent variable.
As the dependent variable, Y relies on the independent variable’s changes.
2. Independent Variable (X)
X is the term used for the independent variables used to make predictions about Y. Some examples include age, income, temperature, and the speed of the machine. By learning about these variables, we can see how adjusting certain predictors can impact the outcome.
3. The Intercept (β₀)
β₀ means the expected value of Y when X equals zero. β₀ is the point where the Y-axis and the regression line cross each other. A unit increase in X is linked to a certain change in Y by the slope coefficient as long as the other variables do not change.
4. The Error Term (ε)
The error term is the difference between the outcome variables predicted by the Linear Regression model and the actual outcome variables. The error term (ε) also measures the difference between actual and predicted outcomes. It is often helpful to get help with linear regression analysis from an expert statistician when interpreting these elements, as they can practically break down each part of the linear regression technique.
Step-by-Step Process Followed by Expert Statisticians When Conducting Linear Regression
Understanding all the steps involved in conducting linear regression is necessary to ensure that the results are accurate and reliable. Paying close attention to every step is necessary when performing linear regression. Each linear regression step helps confirm that the results are correct and the model is reliable.
1. Collecting and Preparing the Data
The initial step is obtaining the data and checking it for any errors, duplications, and missing details. If data is accurate, the models give better results, and researchers can rely on them more. Data collection and preparation should be conducted properly for the analysis to be accurate.
2. Exploratory Data Analysis (EDA)
The next step is to examine the data to check how each variable is spread, find unusual values, and try to spot any relationships. Scatterplots and correlation matrices are the best tools for visualizing exploratory data analysis results. Researchers can opt to get help with linear regression analysis from our expert statisticians to ensure they do not miss crucial points and get accurate and reliable insights.
3. Model Fitting and Assumption Validation
Once researchers have completed EDA, they apply the model using software such as the Statistical Package for the Social Sciences (SPSS), R Studio, Python, or Excel. Researchers verify the model’s results to ensure that the assumptions of linearity, normality, and homoscedasticity are met. At the model fitting and assumption validation stage, researchers ensure that linear regression assumptions are met and confirm that the technique generates useful and reliable outcomes.
4. Interpreting and Reporting the Results
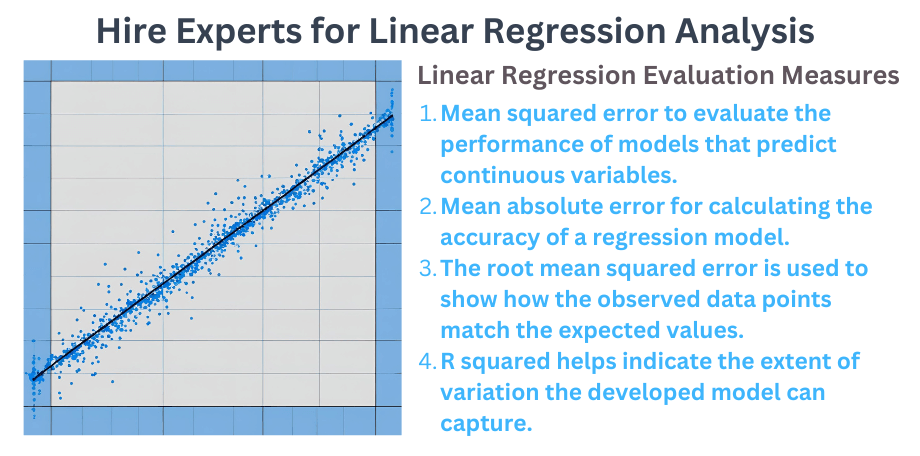
At this stage, the researchers study regression coefficients, determine the statistical indicator R-squared and p-values, and present the results. Visualizing data and reporting findings in a simple and understandable manner facilitates improved decision-making and accurate conclusions. In case one encounters problems with interpreting and reporting results, it is advisable to seek help from experts. We have professionals who assist researchers at every step of the linear regression analysis process, ensuring the process is clear and accurate.
Linear Regression Assumptions
Researchers should understand the underlying statistical linear regression assumptions before using this technique. The linear regression model may provide inaccurate results if these conditions are not fulfilled. If the assumptions are correct, the results are valid and reliable. Linear regression’s first assumption is that the relationship between the dependent and independent variables is linear, meaning a straight line can represent it. Researchers can create scatter and residual plots to verify this relationship. If the data is not organized in a straight line, then it might be necessary to model it differently. The second assumption is about residual independence, which plays a key role in data from time series. The third assumption is that errors have similar spreads for all values of X. The estimates can be biased if these assumptions are not met, and the regression model may not work well.
Testing linear regression assumptions requires special statistical knowledge and tools; therefore, most researchers prefer to get help with linear regression analysis from an expert statistician rather than risk drawing incorrect conclusions. Our expert statisticians can identify and address any issues that may arise, ensuring the model remains valid. Hiring the services of our experts in statistics helps save time and increases researchers’ confidence in their results.
Linear Regression Example
A business owner may want to estimate how much it will sell in a month based on the amount they spend on advertising. Over time, the data has shown a clear line of relationship. A simple linear regression can be used to measure the impact of advertising on sales. The equation is written as Sales = 5,000 + 10 × Ad Spend, meaning that for every extra dollar spent on advertisement, sales increase by $10. The knowledge can drive budget decisions and improve return on investment (ROI). These practical interpretations provide businesses with the evidence they need to make data-driven improvements to their strategies.
However, other factors, such as market trends, competitors’ actions, and economic changes, can influence a business. Researchers should seek help with linear regression analysis from expert statisticians to add and control for the extra variables in the model. Having an expert involved means that all necessary factors are identified, resulting in more useful and accurate results for researchers.
Why Get Help With Linear Analysis From an Expert Statistician?
Working with data and interpreting regression outcomes can be challenging. Our qualified and experienced staff are experts in statistics, helping researchers quickly make sense of their data. Our experts possess advanced skills in conducting linear regression analysis and utilizing statistical software, including SPSS, Excel, Stata, R, SAS, and Python. These skills and knowledge enable them to adjust the regression approach to match the data and goals of each client, whether the analysis is for academic papers, business reports, or scientific studies. Our experts are attentive to details and ensure that all the linear regression assumptions are met, each result is properly interpreted, and all models are explained. Researchers who collaborate with us are guaranteed more than analysis; they also receive peace of mind. We keep our clients informed about the progress of their work at every stage, allowing them to relax while they wait for their tasks. Our team makes complex ideas easy to understand and provides additional tips and guidance to help researchers succeed. Our statisticians support researchers in every step, including selecting a model and getting the final reports ready. Feel free to reach out tous today andadvance your data-driven success without doubts.
Summary
Linear regression analysis technique is among the most widely applied and effective statistical methods for understanding relationships between variables. It is essential to understand the details of linear regression when analyzing business trends, scientific data, or academic studies. Even so, the real world is complex, so statistical methods often require additional effort, as it is common to face multicollinearity, outliers, and broken assumptions. Do not struggle alone with linear regression analysis. Reach out to us to get help with linear regression analysis from an expert statistician from our company. We support researchers in creating data-driven models that can lead to better decisions and more robust conclusions.
We offer custom-made and unmatched linear regression analysis services, even on short deadlines, without compromising quality. Our friendly customer service team is available 24/7 to respond to your inquiries promptly and assist you in placing an order. Join our live chat now to speak with our knowledgeable customer support agents.