Learn Key Differences Between One-Way and Two-Way ANOVA Through Our Guide
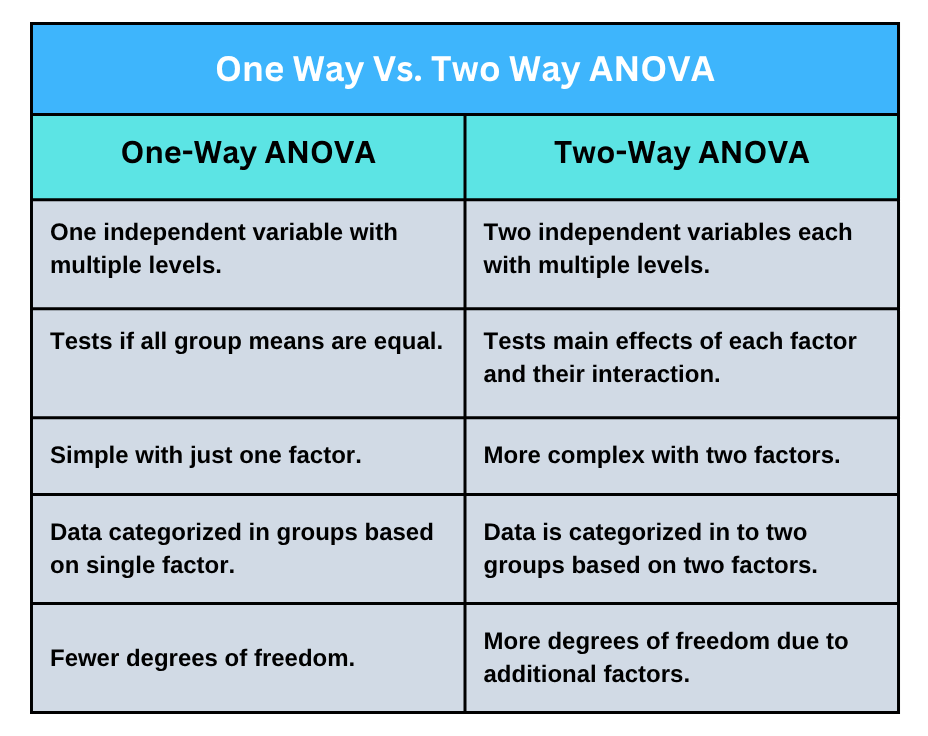
Analysis of Variance (ANOVA) is a parametric statistical test used primarily to determine whether there is a statistically significant difference between the means of two or more groups. ANOVA can be classified into one-way ANOVA and two-way ANOVA based on the number of independent variables. In case you are searching for expert help with ANOVA analysis, contact our professionals for specialized assistance with one-way ANOVA or two-way ANOVA. A one-way ANOVA involves one factor (independent) variable, while there are two independent variables in a two-way ANOVA. By selecting the most appropriate ANOVA technique based on the research design and questions, investigators can effectively analyze and make meaningful conclusions from data. This article highlights the key differences between a one-way ANOVA and a two-way ANOVA, focusing on the assumptions, the tables, how to interpret the results, and practical examples. Additionally, the article contains a discussion of the software tools our statisticians utilize when providing help with ANOVA, including Python, SPSS, and R Studio.
What is One-way ANOVA?
A one-way ANOVA is a statistical procedure used to compare the variance in the group means within a sample, considering only one independent variable. A one-way ANOVA is applied when a study involves a single independent variable with two or more groups and a continuous dependent variable. The primary goal of conducting a one-way ANOVA is to compare three or more categorical groups to determine if there is a difference between them. To get help with conducting a one-way ANOVA, consult our expert statisticians for customized services tailored to your specific research goals.
What are the Assumptions of a One-Way ANOVA?
Assumptions are a set of conditions that must be met for the validity of the one-way ANOVA test, ensuring that the conclusions drawn from the analysis are accurate and reliable. When conducting a one-way ANOVA, researchers should evaluate whether the assumptions are met and find solutions if they aren’t. The assumptions to assess when conducting a one-way ANOVA include:
(a) Absence of outliers.
(b) Presence of one continuous dependent variable and a categorical independent variable with more than two groups.
(c) Each sample from the data sets is acquired from a normally distributed population.
(d) Variance of data in different groups should be equal.
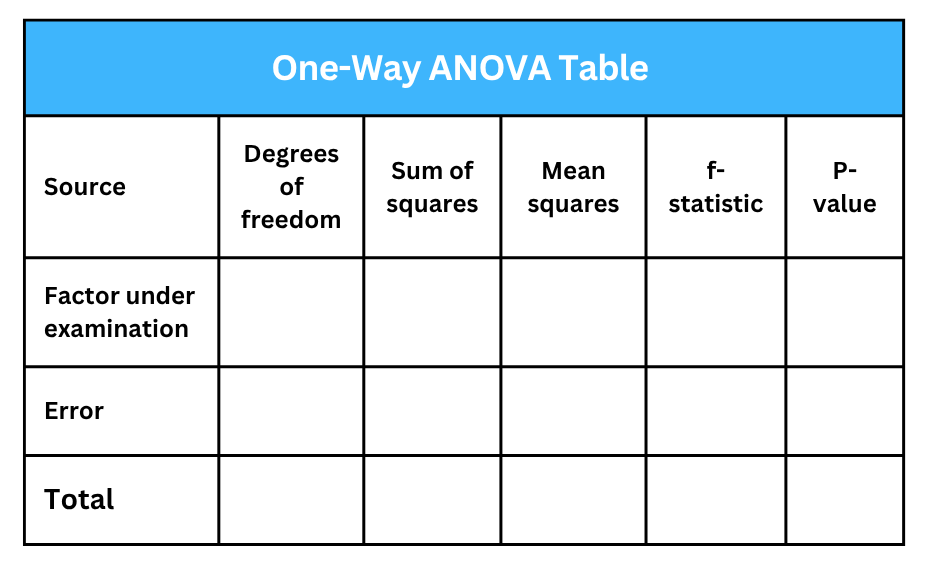
One-Way ANOVA Table
The output of a one-way ANOVA test is typically displayed in a one-way ANOVA table. The components of the ANOVA table include: i). Source of variation in the data, ii) degrees of freedom in the source, iii) sum of squares for each source, iv) mean squares due to the source, v) f-statistics, and vi) p-value. The figure below illustrates the structure of the one-way ANOVA table.
Example of a One-Way ANOVA Test
A healthcare data analyst experiments to evaluate the effect of a new drug in the market. They randomly select 15 participants from a large population and assign each patient one of the three treatment groups. Within each group, the respondents get a different dose of the medicine. In the first group, respondents take 5 milligrams, the second group receives 10 milligrams, and the third group gets 20 milligrams, all in one day. When conducting this experiment, the researcher wanted to know if the dosage level has a significant contribution to improving the patient’s condition and the strength of the effect of the medication on relieving the sickness. To answer these research questions, the investigator uses a one-way ANOVA test.
How to Report One-Way ANOVA Results
To report the results of a one-way ANOVA, the first step involves briefly describing the factor and dependent variables, as well as the research objectives. In the second step, the researcher presents the f-statistic, the p-value, and the findings of the post hoc comparison results (if the p-value is statistically significant). Some post hoc tests that can be applied if the p-value is statistically significant include Tukey’s HSD test, Scheffé’s test, or the Bonferroni test. In the third step, summarize the findings and describe their relevance to the research questions or hypothesis.
What is Two-Way ANOVA?
A two-way ANOVA is a method used to compare the differences between the means of groups categorized based on two independent variables. A two-way ANOVA is conducted to understand the effects of the independent variables on the dependent variables, how two-factor variables affect the dependent variable, and whether the observed effects are random or due to chance. With our expert assistance in two-way ANOVA, clients can gain a deeper understanding of the complex relationships within their data sets.
What are the Assumptions of a Two-Way ANOVA?
First, the dependent variable should be continuous, and the independent variables should be categorical. Second, the variance of the data in the research groups should be similar. Third, data collected for the sample should be acquired from a normally distributed population. Fourth, there should be no outliers that could affect the accuracy of the results.
Two-Way ANOVA Table
To develop the two-way ANOVA table, compute the degrees of freedom, sum of squares, mean square, and the F-statistic. Identify the critical value and determine whether to accept or reject the null hypothesis. The figure below illustrates the general layout of the two-way ANOVA table.

Example of a Two-way ANOVA
A medical data analyst wants to determine the effects of the amounts of sodium and potassium in a patient’s diet on their blood pressure. The analyst feeds the patient a diet containing high, medium, and low amounts of each mineral and, after a specific time frame, measures their blood pressure. Because both sodium and potassium have three levels, the study consists of nine different treatments, therefore making this a two-way ANOVA design.
How to Report Two-Way ANOVA Results
The first step in reporting two-way ANOVA results is to provide a brief description of the independent and dependent variables, as well as the research question to be answered or the hypothesis under investigation. In the second step, conduct a two-way ANOVA to examine the effects and relationships between the independent variable and the dependent variable. The third step involves illustrating the p-values and f-statistics rounded off to the nearest two or three decimal points for simplicity. In the fourth step, include any post-hoc tests if they were conducted and report any significant differences between the groups. The fifth step of reporting the two-way ANOVA results is reporting the effect sizes to quantify the strength of association between the factor and dependent variables.
What is a Two-Way Repeated Measures ANOVA Test?
A two-way repeated measures ANOVA test involves analyzing the interaction between two independent variables across multiple measurements. Statisticians apply a two-way repeated measures ANOVA test when: i). There are two factors in a study (time and condition), ii). the same subjects are involved in all combinations of factors, iii) the dependent variable is continuous and normally distributed, and iv) the objective is to analyze both main and interaction effects. The significance of a two-way repeated measures ANOVA test lies in determining how measurements change over time, such as weight or BMI, across two or more subjects in a study.
Some of the Software Tools We Apply when Providing Help with Two-Way ANOVA
1). Get Help to do Two-Way ANOVA in SPSS
SPSS is a software program used to conduct various analytical techniques, including two-way ANOVA, due to its user-friendly interface and advanced core functionalities. Our experts utilize SPSS to conduct various tests, including testing assumptions, performing two-way ANOVA, and conducting post-hoc tests such as Tukey’s HSD, Bonferroni, and Sidak. They also report, visualize, and interpret the results.
Most scholars and researchers face challenges when trying to conduct a two-way ANOVA in SPSS, such as ensuring necessary assumptions are met, conducting the tests, and interpreting the SPSS output (descriptive statistics, ANOVA table, and post hoc test results). When clients choose to seek help with a two-way ANOVA in SPSS from our certified statisticians, they receive specialized assistance in selecting the most appropriate ANOVA test based on their research questions. With our two-way ANOVA services, we assist clients in conducting ANOVA, interpreting p-values, f-statistics, and effect sizes, and composing detailed data analysis reports.
2). Get Help to do Two-Way ANOVA in Python
Python is a programming language used for automating tasks, web and software development, and conducting multiple data analysis techniques such as two-way ANOVA. When providing help with two-way ANOVA in Python, our experts utilize the anova_lm() function contained in the statsmodel library to conduct the two-way ANOVA and get the ANOVA table. Our experts not only conduct a two-way ANOVA but also provide assistance with interpretation and reporting through our two-way ANOVA services in Python.
Summary
The major difference between a one-way ANOVA and a two-way ANOVA is that the one-way ANOVA involves one independent variable, while a two-way ANOVA is associated with two-factor variables. If you are looking for professionals who provide exceptional ANOVA analysis services, our experts will help you achieve accurate and reliable results. We provide expert assistance in one-way ANOVA and two-way ANOVA, utilizing our specialized skills and cutting-edge software, including Python, R, and SPSS. For specialized assistance with conducting ANOVA tests, please book a consultation with our experts now. Contact us today for any inquiries regarding one-way and two-way ANOVA analysis, or reach out to our friendly customer service agents via our live chat for a one-on-one conversation.