Expert Help with Statistical Treatment of Data in Research
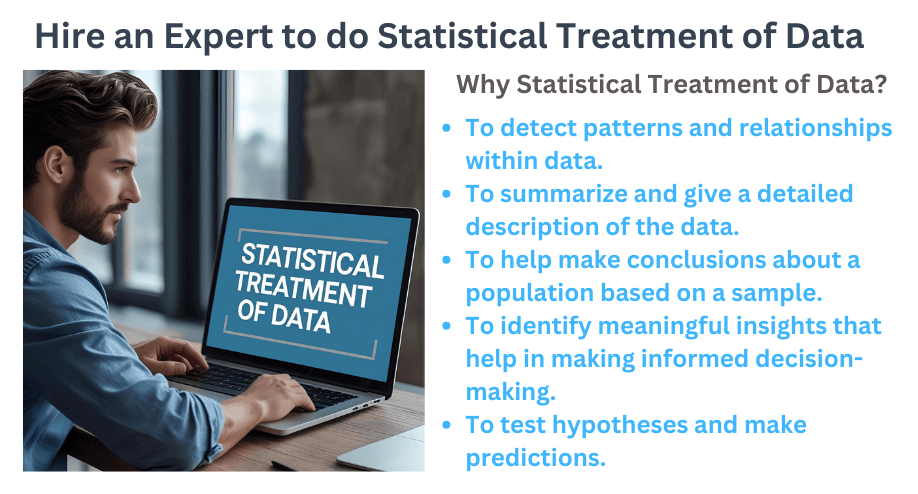
Statistical treatment of data involves applying statistical methods to raw data to derive useful insights. Procedures involved in the statistical treatment of data include designing, collecting, analyzing data, drawing valid conclusions, and reporting research findings. In case you want to hire an expert to do statistical treatment of data in research, our service providers are the best in the market, with years of experience in providing help with conducting statistical analysis. With our professional assistance in the statistical treatment of data, our clients can summarize their data set, identify patterns, test hypotheses, forecast events, draw inferences about a population based on sample data, and make informed decisions. This article provides a comprehensive guide to the statistical treatment of data techniques, encompassing both descriptive and inferential analysis methods.
How to Write a Statistical Treatment of Data in Research
Statistical treatment helps researchers spot any outliers and errors in a data set using statistical methods. Two types of errors can be present in a data set: random and systematic errors. Systematic errors are errors associated with the methodology used or the equipment being used in the research. Suppose a thermometer immersed in pure boiling water at standard pressure reads 105°; then it is improperly calibrated. This results in a systematic error. Random errors are caused by unpredictable factors in the research, such as fluctuating conditions like temperature and weather. Typically, there are no general principles for avoiding these errors, but an expert with long-term experience can easily detect them; this is why getting help with the statistical treatment of data is crucial.
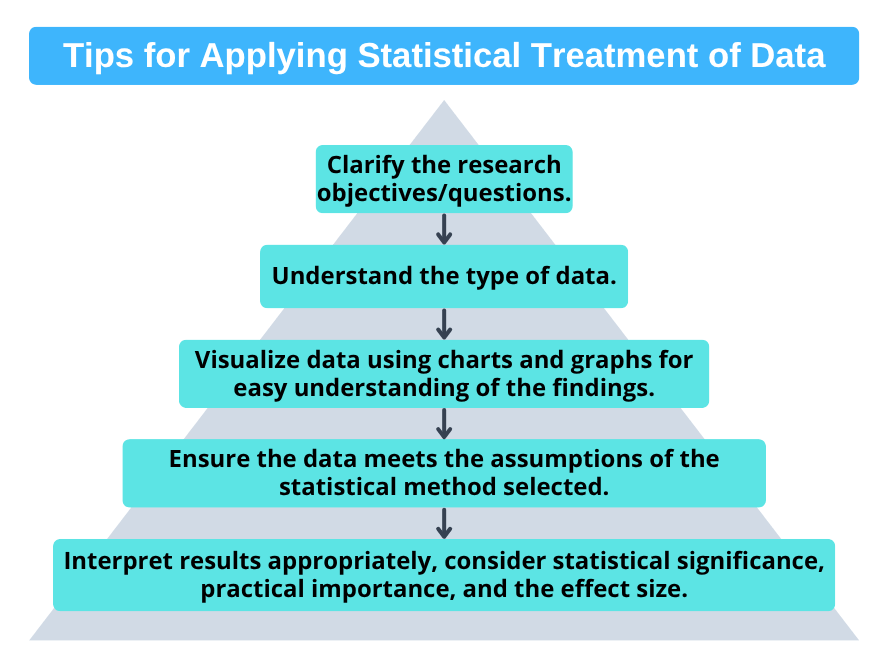
Statistical treatment of data involves a series of steps, from data preparation to reporting. Researchers follow these steps to gain accurate data insights. Below is a comprehensive guide on how to conduct and write a statistical treatment in research:
Step 1: Data collection and preparation
The first step is gathering data relevant to your research question and hypothesis. It can be collected through various methods, such as administering questionnaires and surveys. Data is prepared by checking for missing values or duplicate data to ensure accurate analysis.
Step 2: Summarizing using descriptive statistics
After data collection, the researchers should calculate the descriptive statistics. Descriptive statistics summarize the common features of a data set using measures of central tendency, dispersion, and variation, and graphical methods. Descriptive statistics aim to provide an overview of the data, helping the researcher identify patterns. Below is a comprehensive overview of descriptive statistics:
Descriptive statistics can either be univariate or bivariate. Univariate descriptive statistics examine only one variable at a time, such as the measures of central tendency. In contrast, bivariate statistics compares two variables to see the correlation, such as scatter plots.
1). Measures of central tendency [mean, median, and mode]
The measures of central tendency approximate the dataset’s average using three methods: mean, mode, and median. The mean is the arithmetic average calculated by adding all values in the data set and dividing by the number of participants. The equation for calculating the mean of a data set differs in whether the data set is a sample or a population.
The equation for a sample:
x̄ = (x₁ + x₂ + ⋯ + xₙ) / n = Σxᵢ / n
The equation for a population:
μ = (x₁ + x₂ + ⋯ + xₙ) / N = Σxᵢ / N
Where:
n is the number of observations in a sample.
N is the number of participants in a population.
x̄ is the mean in a sample.
μ is the mean in a population.
xi is the representation of each individual value.
The mode is the data point that occurs most frequently in a sample. There are two instances where the mode is useful in a data set: if data represents frequency categorically, such as hair color, if the mean and median are given.
The median is the numerical data that separates the data into two equal parts. First, the data set is arranged in order, and then the value of the sample size is looked up. If two digits are in the middle, they are added together and divided by 2 to get the median.
2). Measures of variability
The measures of variability are the range, variance, and standard deviation. The simplest is the range, which is the difference between the smallest and the largest data values. The variance is the measure of how far the digits of a data set are from the mean, while the standard deviation is the measure of variance in a data set. The equation for variance and standard deviation is given by:
Variance:

where:
s2 = sample variance
Σ = is the summation
Χ = each value
̄x = sample mean
n = number of values in the sample
Standard deviation:

where:
σ² is the variance.
σ is the standard deviation.
Step 3: Generalize findings using inferential statistics
Descriptive statistics is utilized to summarize the data set sample, while inferential statistics generalize the results to a larger population. Researchers use two main methods of inferential statistics when generalizing findings. These are estimation and hypothesis testing.
1). Hypothesis testing
Hypothesis testing is a technique used to determine whether the findings of a study support a specific theory applicable to a population. The steps involved in hypothesis testing include: i). Formulating hypotheses, ii). selecting the significance level, iii). choosing the most appropriate test, iv). computing the test statistic, v). determining the p-value, and vi). comparing the p-value to the significant level. Common types of hypothesis testing include t-tests, chi-square tests, and analysis of variance (ANOVA).
2). Estimation
There are two estimation points: point estimation and interval estimation. A point estimate is the value of a statistic that has been calculated from a sample and gives an analysis of the parameter population. An interval estimate is a range of values calculated based on the information in the sample stating that the parameter of the population will be within that range.
Step 4: Data visualization
The researcher should present the analyzed results clearly, using graphs and charts to convey the findings effectively. The patterns and trends should be visualized for easy reader understanding. Data visualization enables researchers, business owners, and stakeholders, among others, to identify trends and patterns for easier decision-making.
Step 5: Interpretation
Interpretation involves illustrating the significance and implications of the findings acquired from conducting the data analysis. By interpreting data, our experts help clients understand patterns, trends, and relationships between variables that are present in their data. When clients hire an expert to do statistical treatment of data from our company, we help them make meaningful conclusions that are used to answer research questions, prove hypotheses, make predictions, and inform decision-making.
Step 6: Writing the Report
When writing a report on the statistical treatment of data, our experts begin by defining the research objectives to indicate what the study is aiming to achieve. We then illustrate the statistical techniques used to analyze the data and explain the reason for selecting the methods. Our professionals then present and interpret the results within the context of the stated objectives.
Why Get Help with Statistical Treatment of Data from Our Company?
Our platform features a team of highly skilled statisticians with extensive background experience in providing statistical data analysis assistance to researchers, scholars, business owners, and other professionals.
We select the best experts in the field who hold advanced degrees in fields such as statistics, mathematics, and computer science. Our skills and expertise allow us to handle simple and complex statistical treatment studies as requested by our clients.
Consultants from our statistical analysis company provide comprehensive customer support by understanding their research goals and objectives and assisting them with the statistical treatment of data to gain useful insights.
When providing help with the statistical treatment of data, we utilize our expert skills and advanced analytical software, including Python, SPSS, R, SAS, STATA, Minitab, and Excel to conduct analysis and visualize results.
Our professionals ensure the timely delivery of results, even for clients with tight deadlines, without compromising on the quality of the analysis and findings.
Summary
Statistical treatment of data involves applying analytical techniques to a data set to draw meaningful conclusions. Conducting an effective statistical treatment of data in research requires underlying analytical skills and expertise in tools and techniques, which is why getting professional help is crucial. For exceptional statistical data services tailored to your research objectives, contact our professional consultants today. Our friendly customer service agents will respond to your inquiries promptly. You can also engage in a live conversation with the customer support team via our live chat.