Using R for Data Science: A Guide
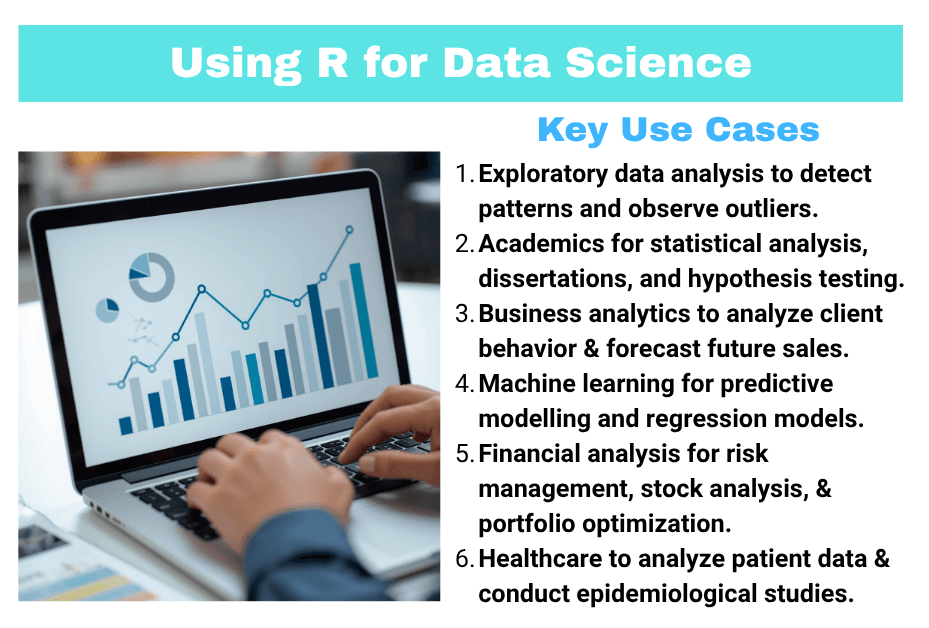
R has become popular in data science, as it includes powerful graphics, visualization, and reporting tools. Among the features of the R programming language are machine learning algorithms and advanced regression techniques. Due to its capabilities for handling complex data structures, most researchers prefer using R for data science. TheR programming language is a suitable analytics platform; therefore, it is not only used in academia but also across major corporations such as Facebook and Google.
This article contains an explanation of how R is used for data science, including problem definition, data collection, cleaning, and model evaluation. We have also discussed why R is used in data science, and the best techniques to apply during the process, such as supervised and unsupervised machine learning and data visualization.
What is R in Data Science?
R is an open-source programming language used for statistical computing, software development, and data analysis. As a crucial tool for data science, R is mostly the first choice for data scientists and statisticians. R is a powerful programming language equipped with tools for creating clear and insightful visualizations. Also, researchers use R to extract, clean, transform, and load data from various sources such as spreadsheets, SQL databases, and unstructured data through NoSQL interfaces. Additionally, the R programming language is reputable for enabling the use of predictive models to forecast future results.
How to Use R for Data Science
As one of the most popular tools for data science, the R programming language has powerful statistical abilities and intuitive syntax suitable for analyzing large datasets, visualizing trends, and building predictive models. The process of using R in data science entails;
1. Problem definition
Using the R programming language for problem identification involves transforming a vague research question into a well-defined and solvable data science challenge. R is also a crucial tool for identifying problems within datasets, supporting efficient data exploration and visualization, to uncover patterns and irregularities. Additionally, using R for problem identification facilitates statistical analysis to identify underlying issues that help define the research problem. Fundamentally, using the programming language helps the researcher understand the scope and feasibility of the problem.
2. Data collection
In R, data collection entails understanding how to import data into the programming language, using specialized packages, from existing files or external sources such as databases or web APIs (Web Application Programming Interface). R is mainly an analysis and statistics environment, as well as a data collection tool. The data collection process involves using specific functions and packages to understand how to make a data frame in R, which is the programming language’s primary structure for analysis.
3. Data cleaning
Cleaning data in R entails using packages such as tidyverse, janitor, or validate, which offer intuitive and powerful functions for data manipulation. Also, during the cleaning process, it’s important to understand how to subset data in R, as well as how to import and explore it to identify issues, and then apply cleaning techniques systematically. The core methods of cleaning data are crucial for handling R data types and addressing common issues such as duplicates, missing values, outliers, and structural errors.
4. Exploratory data analysis
Using the R programming language for exploratory data analysis requires a researcher to follow a structured process involving loading, cleaning, and summarizing data. Exploratory data analysis involves using descriptive statistics and data visualization in R to identify data patterns and relationships. For the exploratory data analysis process to be comprehensive, it’s highly recommended for a data scientist to use the tidyverse suite of packages.
5. Predictive Modeling
Predictive modeling in R involves a structured process, from data preparation to model deployment, supported by a wide range of packages and algorithms. The key stages of building predictive models in R include understanding the problem, defining the objectives, and identifying the variables to be predicted. Another step of predictive modeling is gathering the necessary data and transforming it into a usable format, followed by experimental analysis to discover patterns.
6. Model Evaluation
Evaluating models in R entails splitting data into training and testing sets and generating predictions, using specific packages such as caret, yardstick, or other supporting tools such as ggplot2 for visualization. The evaluation process is done to assess how well the model can generalize to unseen data. Essentially, the evaluation metrics used depend on whether the model is for regression or classification.
Why Using R for Data Science is Recommended
R is widely used in data science to transform unprocessed data into insights through progressive techniques and high-quality graphical presentations. R is used in data science due to;
- Tailored for statistics and data analysis: The R programming language is designed for data examination, particularly excellent at complex statistical tasks such as regression analysis, time-series modeling, and clustering.
- Superior visualization capabilities: R has excellent data visualization capabilities in data science, as its ecosystem enables the creation of publication-ready and high-quality graphics that surpass other languages.
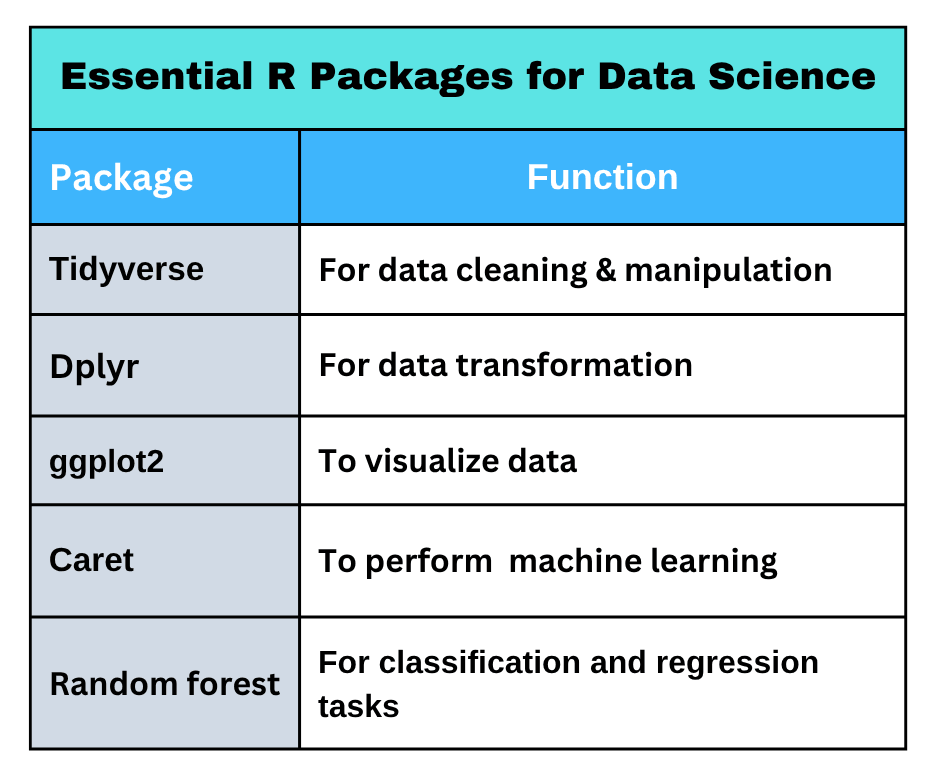
- Vast package ecosystem: R has a vast package ecosystem that provides a comprehensive, community-driven, and specialized collection of tools that support the data science lifecycle stages from data manipulation to machine learning and reporting.
- Open source and free: As an open-source language with a vibrant and supportive community, R is free for researchers and businesses to use, download, and modify to avoid hefty software costs while ensuring reproducible and flexible analysis.
What are the Best Data Science Techniques?
Methods applied in using R for data science are crucial for businesses to transform raw data into meaningful insights, improve decision-making, and gain a competitive edge in the market. The methods used in data science include;
1. Machine Learning – Supervised and unsupervised
Supervised machine learning is a data science method that trains algorithms on labeled data to identify inputs and outputs, to enable accurate future predictions. The technique is suitable for supervised tasks where historical input and output are aligned and able to guide the model’s creation process. Conversely, an unsupervised machine learning technique is used to analyze unlabeled data to find hidden structures, patterns, or relationships. The data science method is essential for grouping, reducing dimensionality, and detecting anomalies.
2. Natural Language Processing
Natural language processing is a powerful data science method used to convert unstructured speech and text into structured and actionable data. With natural language processing, researchers can examine and obtain actual data, as the method enables computers to interpret, analyze, and generate human language for tasks such as chatbots and sentiment analysis. As a subset of artificial intelligence, natural language processing technique is instrumental in driving efficiency and generating valuable insights through computerized text analysis.
3. Time Series Analysis
Time series analysis is a key data science technique, essential for examining chronological datasets. The analysis process is primarily done to identify trends, cycles, and seasonal patterns suitable for forecasting. By modeling data points gathered over consistent intervals, time series analysis enables predictive and proactive decision-making in areas such as finance, marketing, and manufacturing.
4. Data Visualization
Data visualization is a data science technique used to transform multifaceted and raw data into actionable insights through visual formats such as graphs and charts. Data visualization enables quick identification of trends, patterns, and anomalies to accelerate decision-making. Also, the visualization method aids in cleaning and simplifying complex data for diverse audiences.
Summary
One of R’s primary applications is building machine learning algorithms, due to its massive and extensible package catalog. The R programming language enables structured data manipulation and the development of publication-quality visualizations through packages such as dplyr and ggplot2, which are a part of tidyverse. Despite the steep learning curve, R has specialized strengths in statistical computing and a vibrant community support system, thus making it a vital tool for transforming raw data into actionable insights.
Essentially, using R for data science proves its capabilities in being more than just a programming language, as it is a comprehensive and open-source ecosystem that can handle the entire data pipeline. Ready to unlock the full potential of your data? Take the next step now and transform your data into actionable insights by contacting us today.